Acquisition Dashboard
The Acquisition dashboard answers the most important marketing question: how are people finding my website?
Every visit to your site came from somewhere: a Google search, a social media post, a direct bookmark, or a link in an email. This dashboard breaks down all of those sources so you can see what is working and what is not.
Overview Metrics#
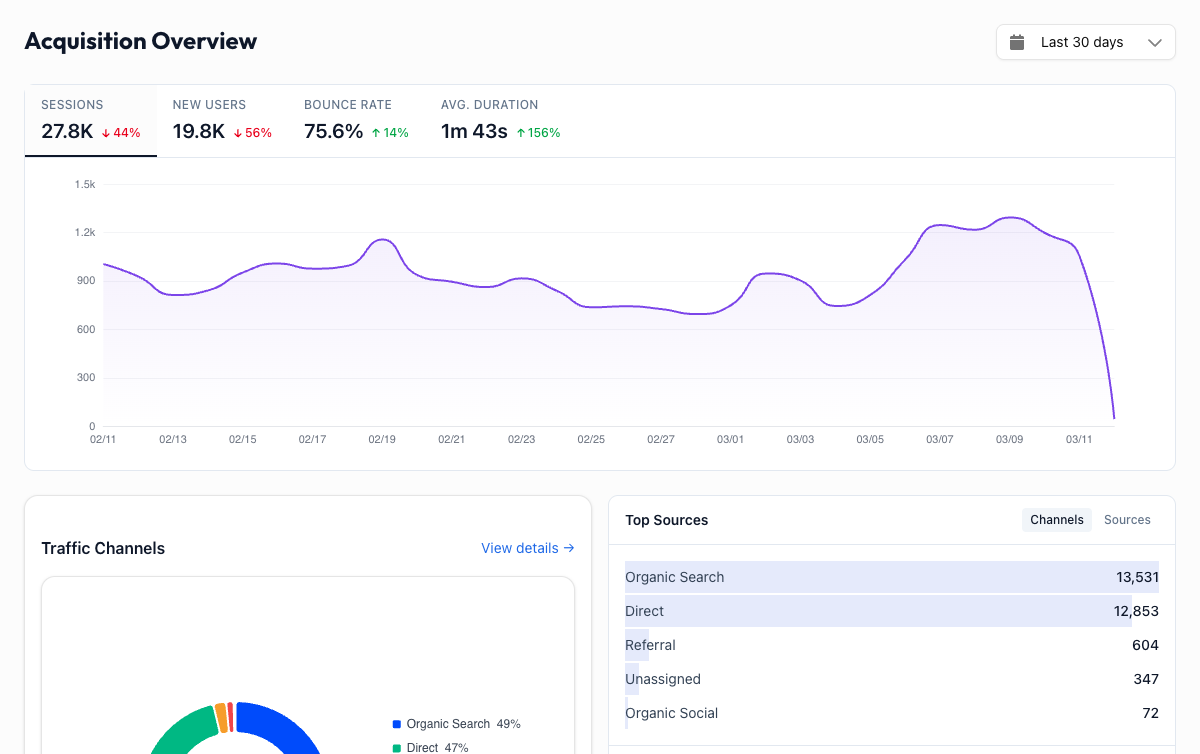
Four metric cards at the top give you the big picture. Click any card to switch the trend chart.
| Metric | What it means |
|---|---|
| Sessions | Total visits from all sources during the selected period |
| New Users | First-time visitors, a good measure of whether your channels are reaching fresh audiences |
| Bounce Rate | Percentage of visits where someone left after viewing just one page. Useful for judging landing page quality by source |
| Avg. Duration | How long the average visit lasts. Longer durations usually mean higher-quality traffic |
Traffic Channels#
A pie chart and a ranked list break down your traffic into standard channels. Here is what each one means:
| Channel | What it means |
|---|---|
| Organic Search | Visitors who found you through a search engine like Google or Bing, without clicking an ad |
| Direct | Visitors who typed your URL directly, used a bookmark, or came from an untracked source |
| Social | Visitors from social media platforms like Facebook, Twitter/X, LinkedIn, or Instagram |
| Referral | Visitors who clicked a link on another website (a blog post mentioning you, a partner site, etc.) |
| Visitors who clicked a link in an email (requires UTM parameters to be tracked correctly) | |
| Paid Search | Visitors who clicked a paid ad in search results (Google Ads, Bing Ads) |
Click "View details" on the Traffic Channels card to explore the full breakdown with session counts, bounce rates, and engagement metrics per channel.
Traffic by Channel Over Time#
A stacked area chart shows how your channel mix has changed over the selected date range. Each color band represents a channel, stacked to show total traffic.
This chart is great for spotting:
- Seasonal patterns, like whether organic search dips on weekends
- Campaign impact, such as whether your social channel spiked during a promotion
- Channel health, and whether any channel is trending down over time
Source / Medium#
While channels give you the category, Source / Medium gives you the specifics. It uses the format source / medium, for example:
google / organic: came from a Google search (not paid)facebook / referral: clicked a link shared on Facebooknewsletter / email: clicked a link in your newsletter(direct) / (none): typed the URL or used a bookmark
This level of detail is essential when you have multiple campaigns running on the same channel. You might know "Social" is driving traffic, but Source / Medium tells you whether it is coming from LinkedIn or TikTok.
Campaigns (UTM Tracking)#
When you share links with UTM parameters, the Campaigns sub-dashboard groups traffic by those tags so you can measure the performance of specific initiatives.
UTM parameters are tags you add to the end of a URL. There are three main ones:
| Parameter | Purpose | Example |
|---|---|---|
utm_source | Where the traffic comes from | newsletter, facebook, partner-site |
utm_medium | The marketing medium | email, social, cpc, banner |
utm_campaign | The specific campaign name | spring-sale, product-launch, weekly-digest |
A tagged URL looks like this:
https://yoursite.com/pricing?utm_source=newsletter&utm_medium=email&utm_campaign=spring-sale
When someone clicks that link, Calm Analytics automatically tracks it under the campaign name "spring-sale", so you can see exactly how many visits and conversions that campaign generated.
Not seeing campaign data?
Campaign data only appears when your links include UTM parameters. If the Campaigns section looks empty, your links probably do not have UTM tags. Add them to any link you share in emails, social posts, or ads. Most email marketing tools add UTM parameters automatically.
Sub-Dashboards#
Channels
Full channel breakdown with sortable data tables showing sessions, users, bounce rate, and duration per channel.
Source / Medium
Every traffic source with its medium, so you can drill into the exact origin of each visit.
Practical Insights#
This is where you find out if your marketing is actually working. Some questions the Acquisition dashboard answers:
- "Did that blog post I promoted on Twitter drive any traffic?" Check the Social channel or look for
twitter / socialin Source / Medium. - "Is my SEO improving?" Watch the Organic Search trend line over weeks and months.
- "Which email campaign performed best?" Compare campaign names in the Campaigns view.
- "Where should I spend my ad budget?" Compare Paid Search bounce rates and durations against Organic. If paid traffic bounces immediately, the landing page or targeting needs work.
Combine with Audience data
The Acquisition dashboard tells you how people find your site. The Audience dashboard tells you who those people are. Together, they help you understand whether your marketing channels are bringing the right visitors, not just more visitors.