Behavior Dashboard
The Behavior dashboard answers one question: what are people doing on your website? It shows you which pages get the most attention, how visitors navigate between pages, and where they drop off.
If Acquisition tells you how people arrive, Behavior tells you what happens next.
Overview Metrics#
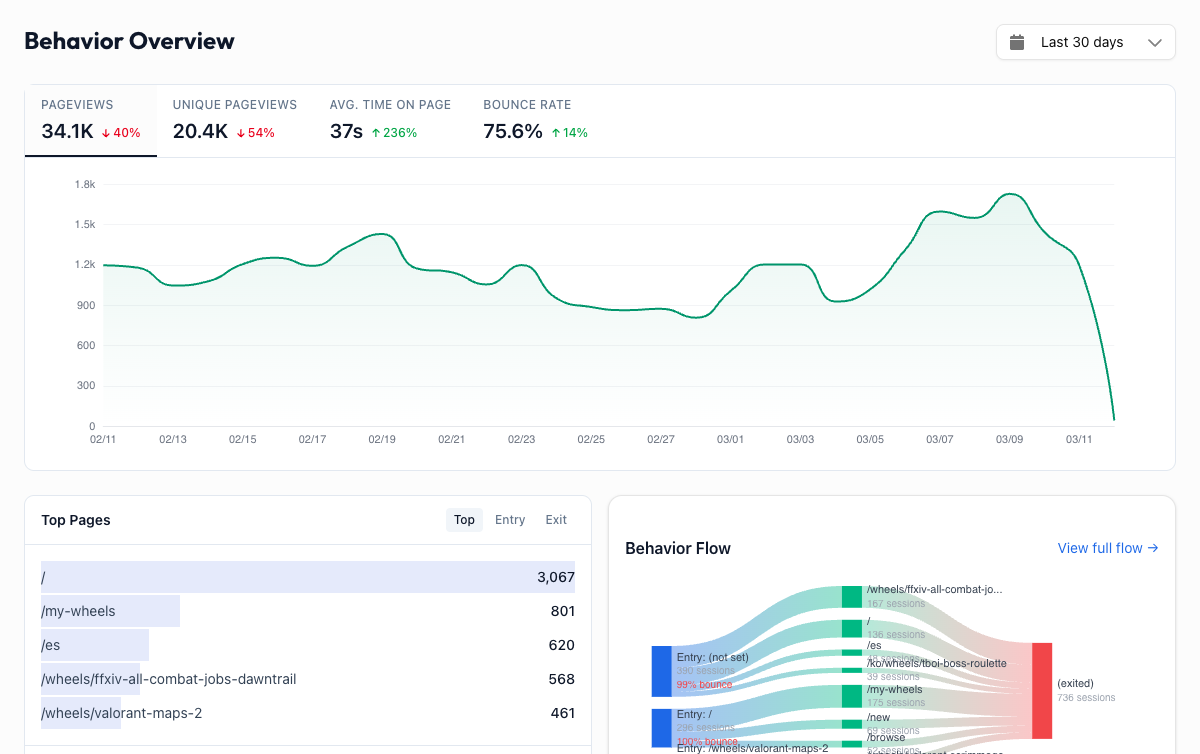
At the top of the dashboard, you see four key metrics for the selected date range:
| Metric | What it means |
|---|---|
| Pageviews | Total number of pages loaded. One visitor viewing 5 pages = 5 pageviews. |
| Pages per Session | Average number of pages a visitor views in a single session. Higher is usually better because it means people are exploring your site. |
| Avg Session Duration | How long the average visit lasts. Short durations on content-heavy pages suggest visitors aren't finding what they need. |
| Bounce Rate | Percentage of visitors who leave after viewing only one page. A high bounce rate on your homepage is a red flag. On a blog post, it can be perfectly normal. |
Each metric includes a comparison to the previous period, so you can see whether engagement is trending up or down.
Behavior Flow#
The Behavior Flow is a visual Sankey diagram that shows how visitors navigate through your site. It maps the actual paths people take, for example Homepage to Pricing to Sign Up.
Thicker bands mean more traffic along that path. Thin bands represent less common routes. This makes it easy to spot your most popular user journeys at a glance.
Use Behavior Flow to answer questions like:
- Where do homepage visitors go next? If most people leave instead of clicking through to a product page, your homepage messaging may need work.
- What's the path to conversion? Trace the steps visitors take before reaching your sign-up or checkout page.
- Where do people get lost? If a significant chunk of traffic goes from your pricing page back to the homepage, the pricing page might be confusing.
All Pages#
The All Pages table lists every page on your site ranked by pageviews. For each page, you see:
- Pageviews: how many times the page was loaded
- Avg Time on Page: how long visitors spend reading
- Entrances: how often this page was the first one a visitor saw
- Exits: how often this page was the last one before a visitor left
You can sort by any column, search for specific pages, and paginate through the full list. This is your go-to view for understanding which content performs best.
Landing Pages#
Landing Pages shows where people enter your site, the first page they see in a session. This is critical because first impressions drive whether someone stays or bounces.
Pay close attention to bounce rate here. If a landing page has a high bounce rate, it's not meeting visitor expectations. Either the page content doesn't match what brought them there (an ad, a search result, a social post), or the page itself isn't compelling enough to explore further.
Your top landing pages are your front doors. Make sure they're doing their job.
Exit Pages#
Exit Pages shows where people leave your site, the last page they view before closing the tab or navigating away.
Some exits are natural. Your "Thank You" page after a form submission should have a high exit rate. Your blog posts will naturally have high exit rates too.
But high exit rates on the wrong pages signal a problem. High exit rate on your checkout page? That's a conversion problem. High exit rate on your pricing page? Visitors might be confused or put off by what they see.
Putting It All Together#
Behavior data tells you what's working and what's leaking. The most actionable approach is to focus on pages with high traffic but poor engagement: lots of pageviews combined with high bounce rates, short time on page, or high exit rates. These are pages that attract attention but fail to hold it.
Start there, and you'll get the biggest return on your optimization effort.