Real-Time Dashboard
The Real-Time dashboard shows you who is on your site right now. It auto-refreshes every 30 seconds, so you can watch traffic flow in as it happens.
This is the dashboard you open right after publishing a blog post, sending a newsletter, or launching a campaign. It answers one question: is anyone actually showing up?
Active Users#
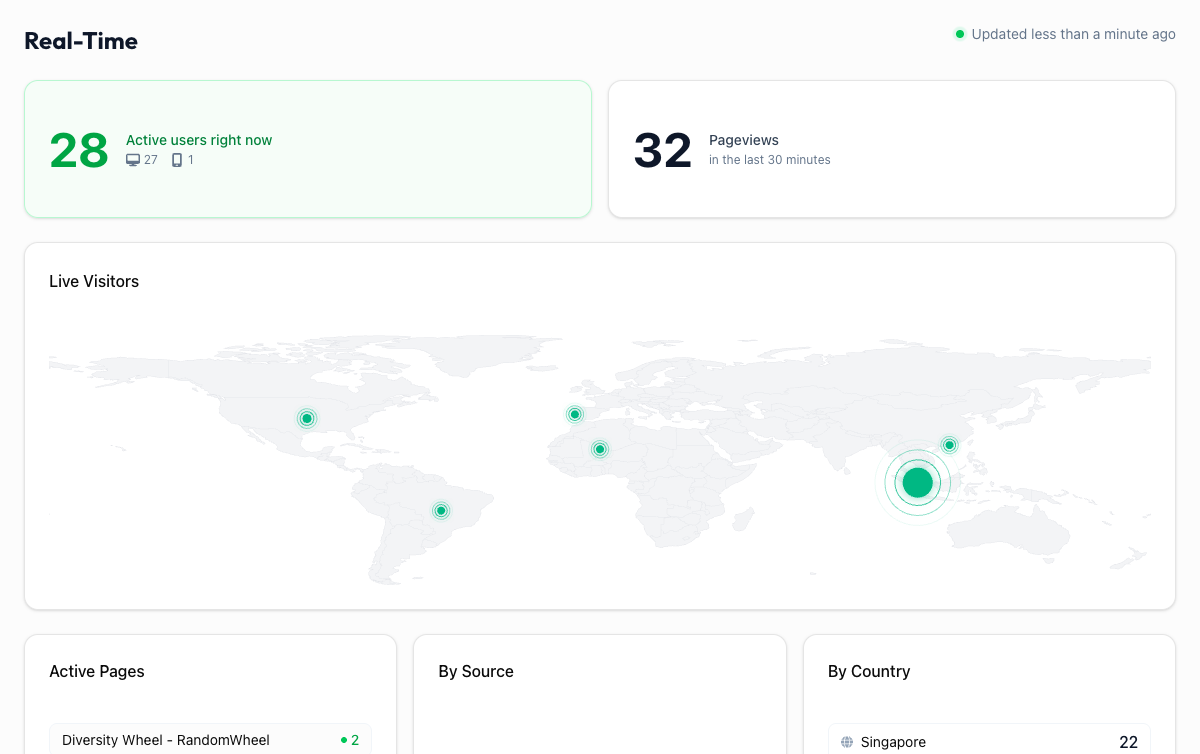
The big green number at the top left shows the count of people actively browsing your site in the last 30 minutes. Next to it, you will see a quick breakdown by device type (desktop, mobile, tablet) so you know how people are accessing your site right now.
To the right, a second card shows Pageviews in the last 30 minutes, the total number of pages being loaded across all active visitors.
Real-time data is approximate
GA4 updates real-time data with a slight delay (typically 1-2 minutes). The numbers you see reflect very recent activity, but they are not instantaneous. Do not be surprised if the count does not jump the exact second someone lands on your site.
Live Visitors Map#
A world map with scatter dots shows where your current visitors are located geographically. Larger dots mean more active users in that region. This gives you a quick visual pulse of your global reach at any moment.
Active Pages#
The Active Pages panel lists the specific pages people are viewing right now, ranked by active user count. Each row shows a green dot and the number of people currently on that page.
This is especially useful when you:
- Publish new content: check if the new page is showing up in the active list
- Run A/B tests: see which variant is getting more real-time attention
- Troubleshoot issues: if users report problems, see which pages are currently active
By Source#
The By Source panel shows where your current visitors came from. You might see entries like "google", "twitter", "direct", or a specific referral domain. This tells you which channels are driving traffic at this exact moment.
By Country#
The By Country panel ranks countries by current active users. If you just shared content targeting a specific region, this is where you confirm it is reaching the right audience.
When to Use Real-Time#
The Real-Time dashboard is not for daily analysis. That is what the Overview dashboard is for. Real-Time shines in specific moments:
- Just posted on social media? Open Real-Time to watch the traffic spike arrive within minutes.
- Launched an email campaign? See the wave of opens translate into site visits.
- Running a live event or webinar? Monitor attendance in real-time.
- Deployed a site change? Confirm that traffic is still flowing normally after a deploy.
- Testing tracking? Verify that your visit shows up in the active users count.
Keep it open during launches
Open the Real-Time dashboard in a second tab during any campaign launch or content drop. Watching the numbers climb in real-time is the fastest feedback loop you will get, and it helps you catch issues early if traffic does not arrive as expected.